The Quantified Student Conference 2018: photo-impression
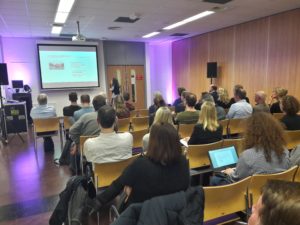
 The 11th of january, the third annual Quantified Student conference was set to begin. People were flooding in the building R5 at FontysICT in Eindhoven. All were wondering what to expect of this conference. Could it give us new insights as to how to measure everything in students’ daily lives? Can we measure everything just like that, or do we have to take privacy into account? A lot of questions that undoubtedly were going to be answered in the conference ahead.
Before starting this photo-impression, if you want to read the presentation once more, you can download it here: http://bit.ly/2DBMMGs
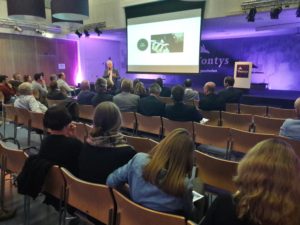
We started the day with an opening of our chairwoman Miriam Wesselink, who opened the conference and welcomed everybody. 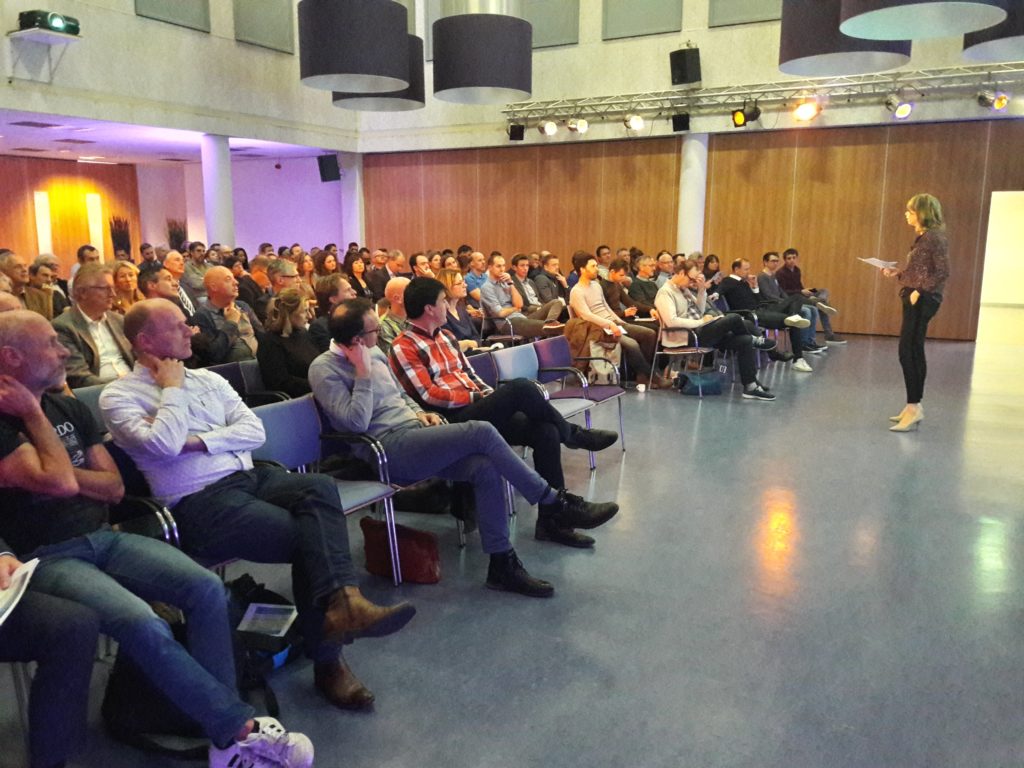
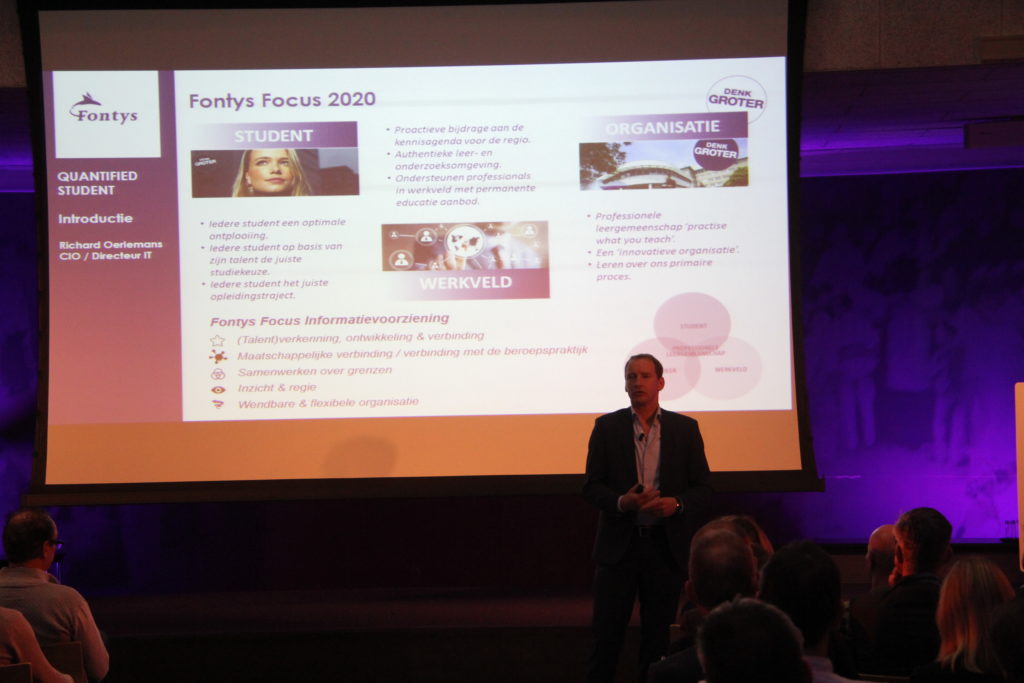
After that it was Richard Oerlemans, Head of IT, to give a short talk about quantifying data at Fontys.
Eric Slaats, Associate Lector at FontysICT, gave a talk about New Education and the Quantified Student.
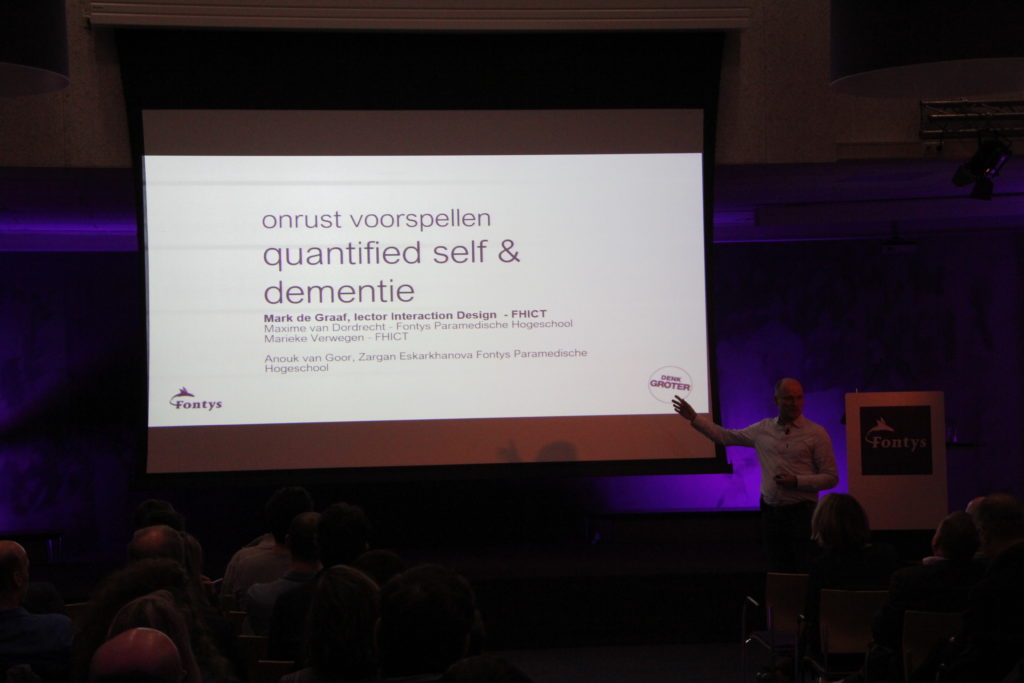
Mark de Graaf, Lector User Interaction Design, gave a speech about Quantified data and its uses for the elderly with dementia.
After that, it was Rens van der Vorst’s turn to give us some info about the history of the conference and how to look forward.
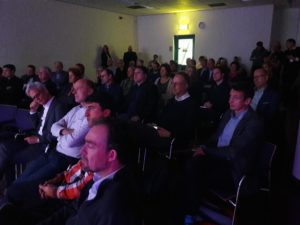
After Rens, everyone split up to go to one of the paralel sessions of their choice. The sessions were divided in three subjects. We had Student projects, Programmatic testing and Privacy sessions.
Erdinc Sacan, blogger at Dutch Cowboys and teacher at Fontys, told us about ‘the dark side of data’.
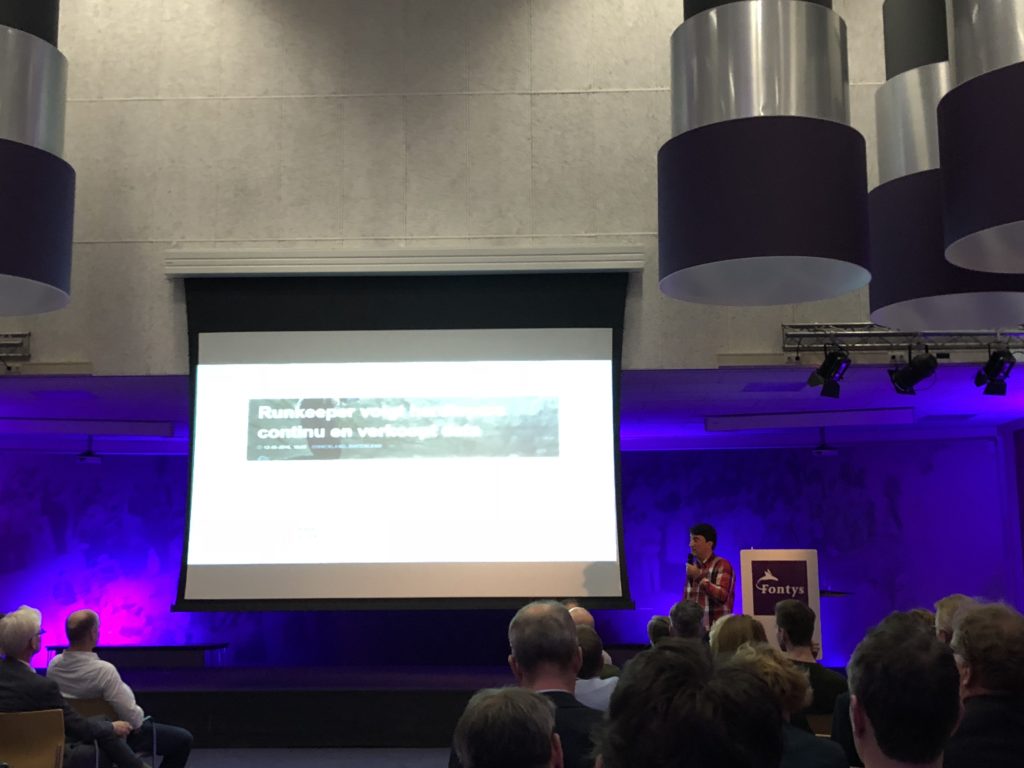
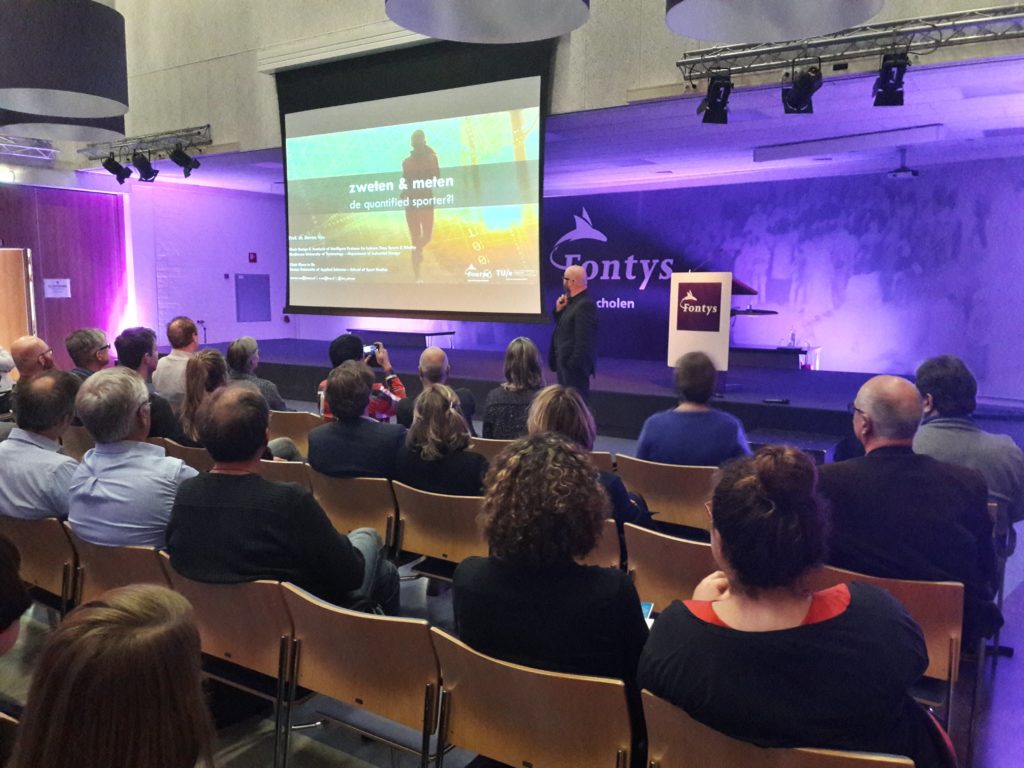
Steven Vos was next and told us about Quantifying data in sports.
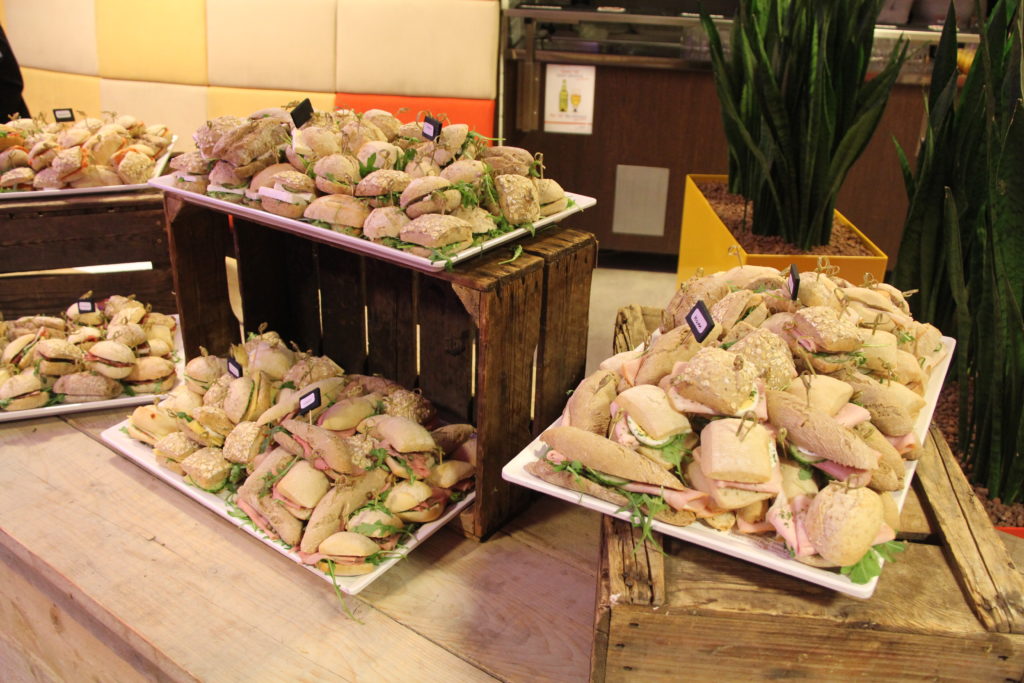
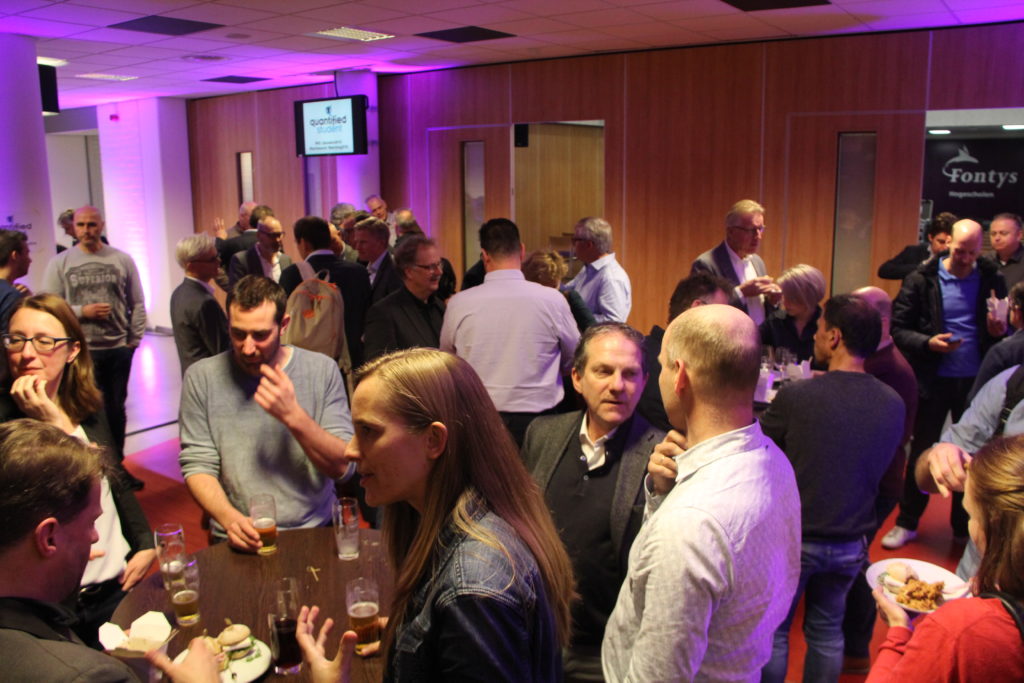
After Steven, the conference ended, with much thoughts to be processed. And where better to proces this than with a drink and some delicious snacks.