INTRODUCTION OF THE PROGRAMM
In this programm we are trying to find out if it is possible to collect data on the educational process and find patterns/correlations/causality to help us become a better educational institution? This is something different than learning analytics because we are not looking at online data (like logins on the LMS), we are not looking at static data (like previous education, age and so on) but we are looking at things that are happening on campus.
The idea is that we – in spite off all kinds of e-learning initiatives – still spend a lot of money on our building. We are all the time designing, builiding and renovating. This implies that we believe in the contribution of physical education to the learning process. But how do measure this? What is happening in our buildings? What works? What does not? That are the key questions that we are doing experiments and projects on.
CURRENT PROJECTS
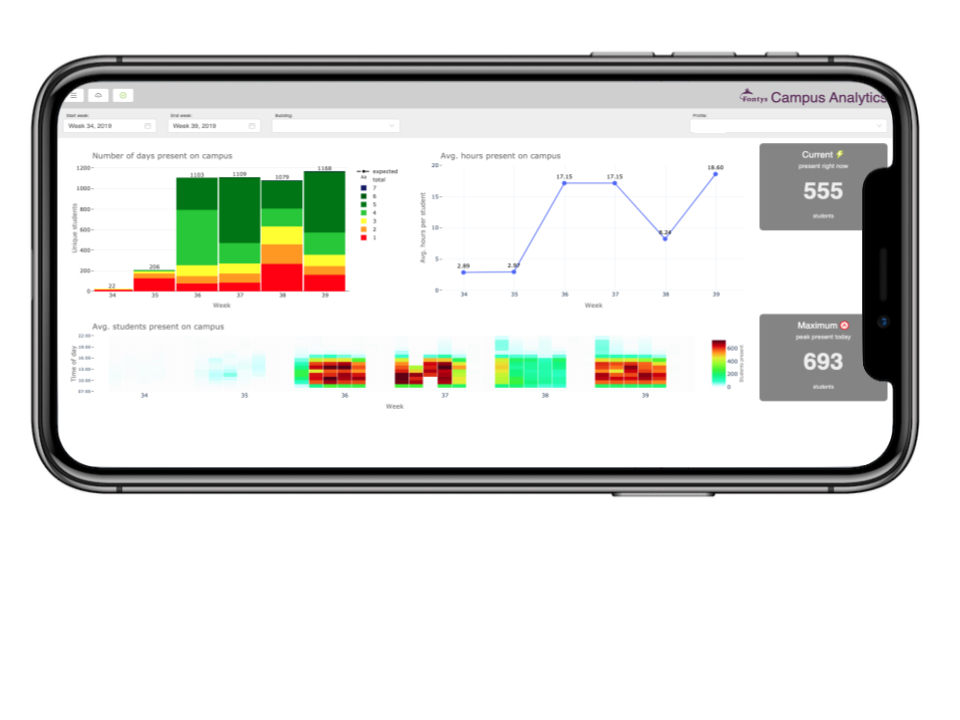
- We did a lot of experiments on using WIFI data to generate relevant information for our faculties. This experiments came together in a project that we are building now, with a company called 12CU. We launched Fontys – wide in january 2020. Then came Covid, in which we used a Covid Counter.
Today we can exactly see how much time students of different kinds of education spent at school.
PAST PROJECTS
- Studenten of digital marketing (2021) created all kinds of nudges to convince student to come to school. For example Snapchatfilters that only work when you are on campus (download the report (Dutch): Adviesrapport – definitief);
- Students of the minor datascience have created dashboards that can:
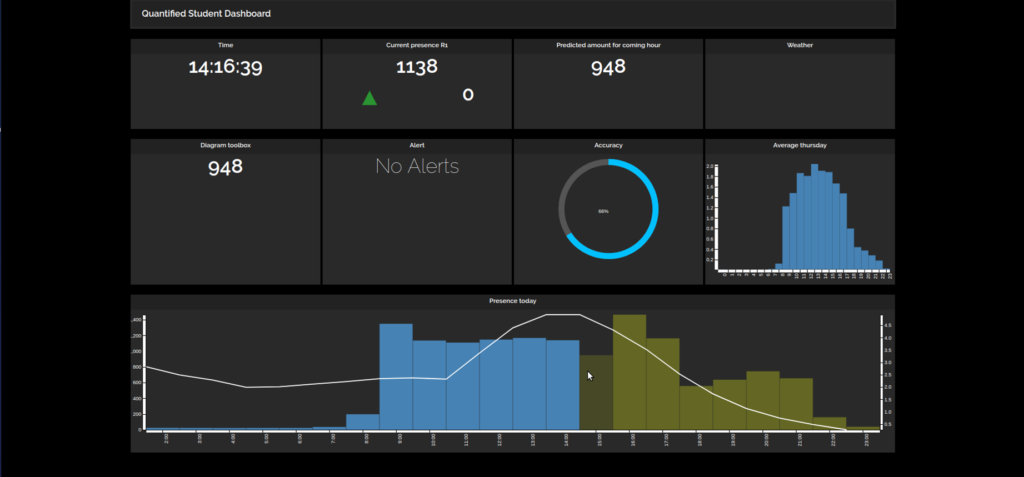
a. Measure the number of people in a building
b. Predict – based on machine learning – the number of people in the next hour/day/etc…
c. Measure the infuences of temperature (outdoor and indoor), daylight and rain to refine predictions.
They were able to predict all kinds of trends by using Machine Learning. They could show the number of people in a building. Predict the number of people in an hour/day/week with declining predictability. But the algorithm is still learning.
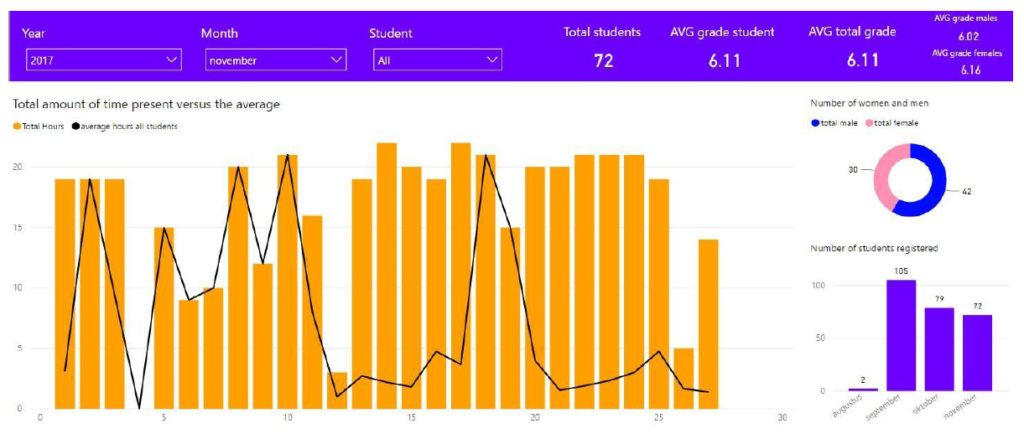
Project Number Two: Can you use the data to empower the students?
2. Students researched the question: do students care about these results. The results was an interesting report in which they listed opportunities & problems also in an international context. They also created a WIFI – based dashboard that showed that students lose interest pretty fast. Read the report here
We had a group of data science students that are using WIFI data, sensoring data and open data to find out if their are patterns between weather and attendance, attendance and student succes and so on. They are also researching if it is possible to create Visuals that make people think about the offline learning process. They are doing this for the R1 Building, which is 3500 users concurrent. More information on their: POSTER Fontys.